The first half of 2025 has been one of the most turbulent periods for supply chains in recent memory. From renewed tariff wars to fresh geopolitical flashpoints, logistics professionals have had to contend with a constantly shifting landscape.
At the same time, structural challenges around skills, safety, and sustainability have continued to grow. Here we review six developments that defined H1 2025.
1. Tariffs return to the fore
The pause in US tariff escalation ended in August, with the White House reintroducing “reciprocal” tariffs that apply baseline duties of 10% to all countries and higher rates of 10–41% depending on origin. The UK sit at the low end, while Syria faces the steepest levels. Brazil has been singled out further, hit by an additional 40% levy. Canada also saw tariffs raised from 25% to 35% on certain goods, justified by Washington’s claim that Ottawa has not done enough to curb fentanyl flows.
The executive order applies from 7 August 2025, with a grace period allowing cargo already loaded onto vessels before that date to arrive until 5 October 2025. To add complexity, US Customs will also impose new fees on Chinese-built or operated vessels from 14 October, potentially forcing alliances such as the Ocean Alliance into costly fleet reshuffles. Carriers are already working through how to redeploy capacity to avoid penalties, with COSCO and OOCL particularly exposed.
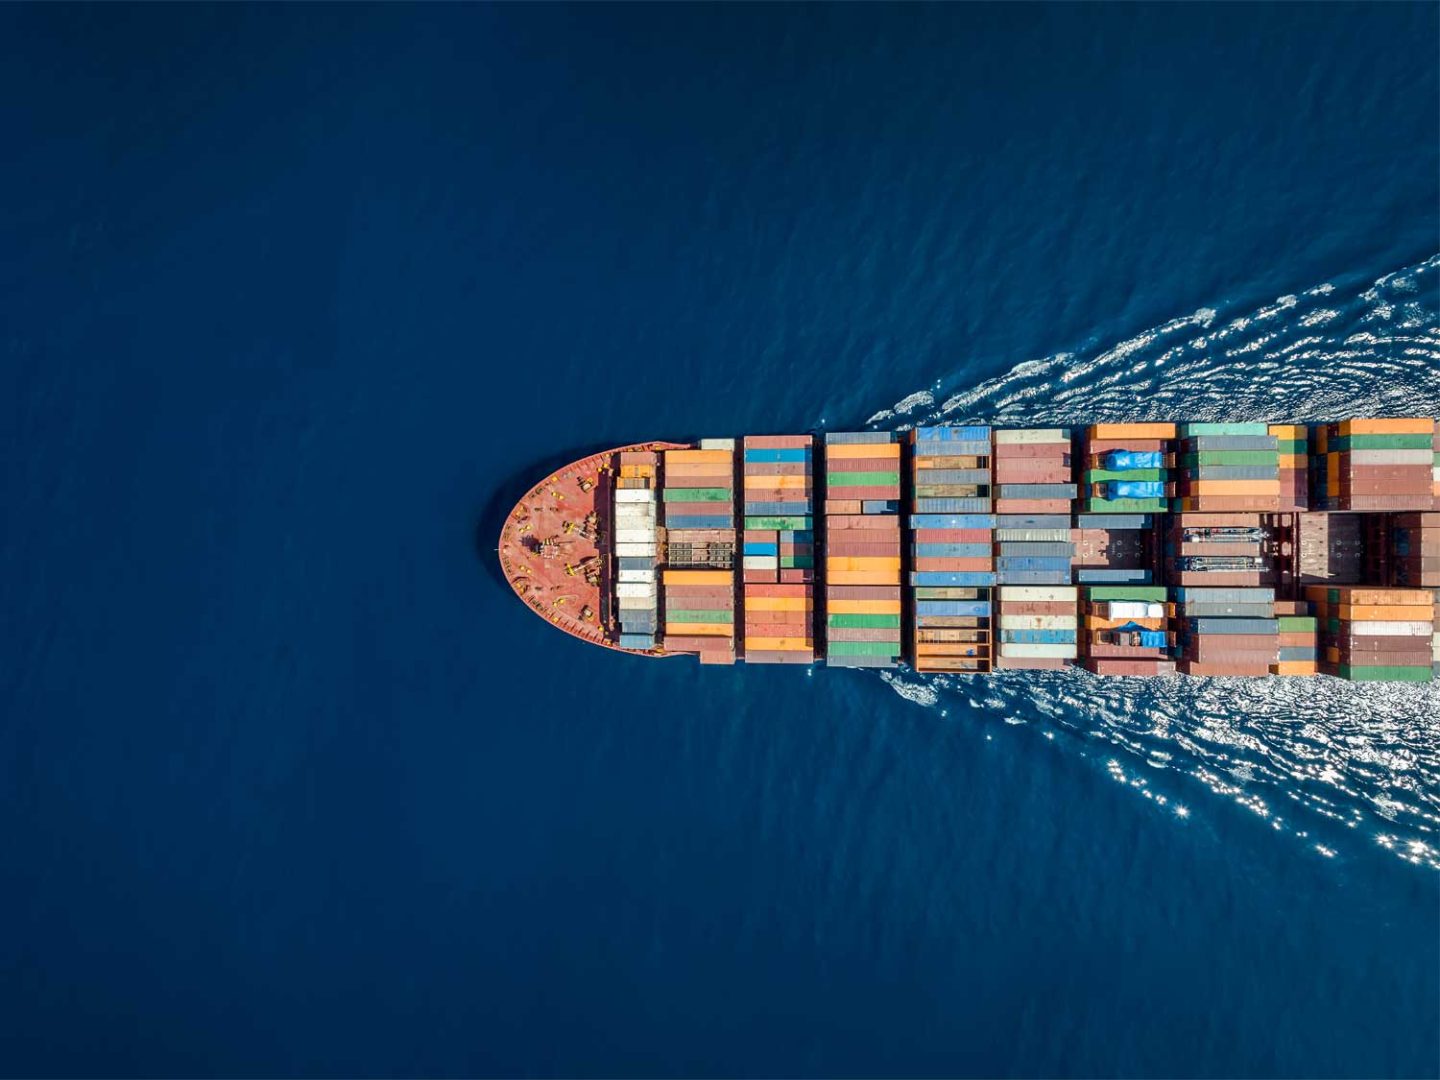
2. New shipping alliances reshape networks
The recomposition of global shipping alliances in Q1 has reshaped carrier strategies. The launch of the Gemini Cooperation between Maersk and Hapag-Lloyd marked one of the most significant realignments in recent years, focused on achieving 90%+ schedule reliability. Shippers are already seeing more dependable services, but questions remain about whether premium pricing will follow.
Other alliances, particularly Ocean and THE Alliance (now Premier Alliance), are recalibrating networks, with competition sharpening across Asia–Europe and transpacific trades. For shippers, the alliance changes mean rethinking service contracts and adapting to new network structures that could endure for much of the decade.
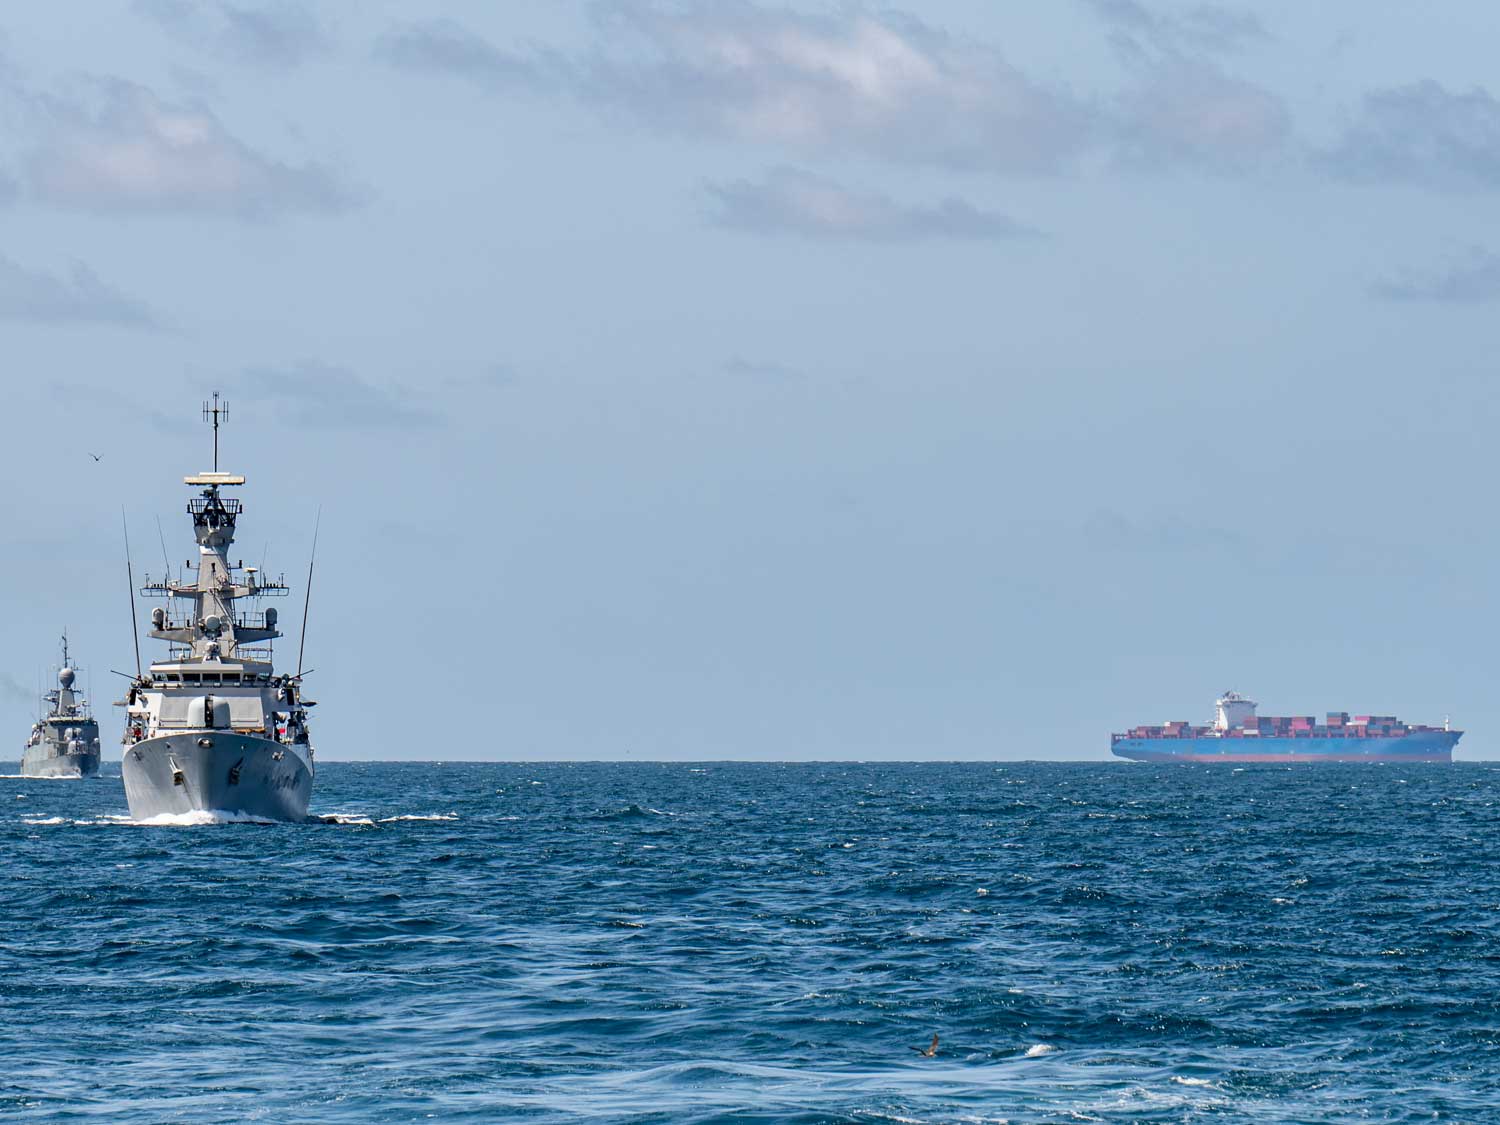
3. Houthi attacks deepen Red Sea crisis
The Red Sea crisis, triggered by Houthi rebel attacks, has now stretched on for nearly two years. In July 2025 the threat escalated further with the sinking of the Magic Seas, a Greek-operated vessel targeted for its links to companies calling at Israeli ports. Analysis suggests that one in six vessels globally could now be considered threatened under the Houthis’ broad definition of violators.
For container lines, this effectively rules out a return to Suez Canal routings before 2026 — and possibly not until 2027. Rerouting around the Cape of Good Hope adds up to two weeks to Asia–Europe journeys, pushing up costs and insurance premiums, and putting additional strain on fleet capacity. The Red Sea instability has been a reminder of how localised conflicts can have global consequences for supply chains.
4. Logistics skills shortages persist
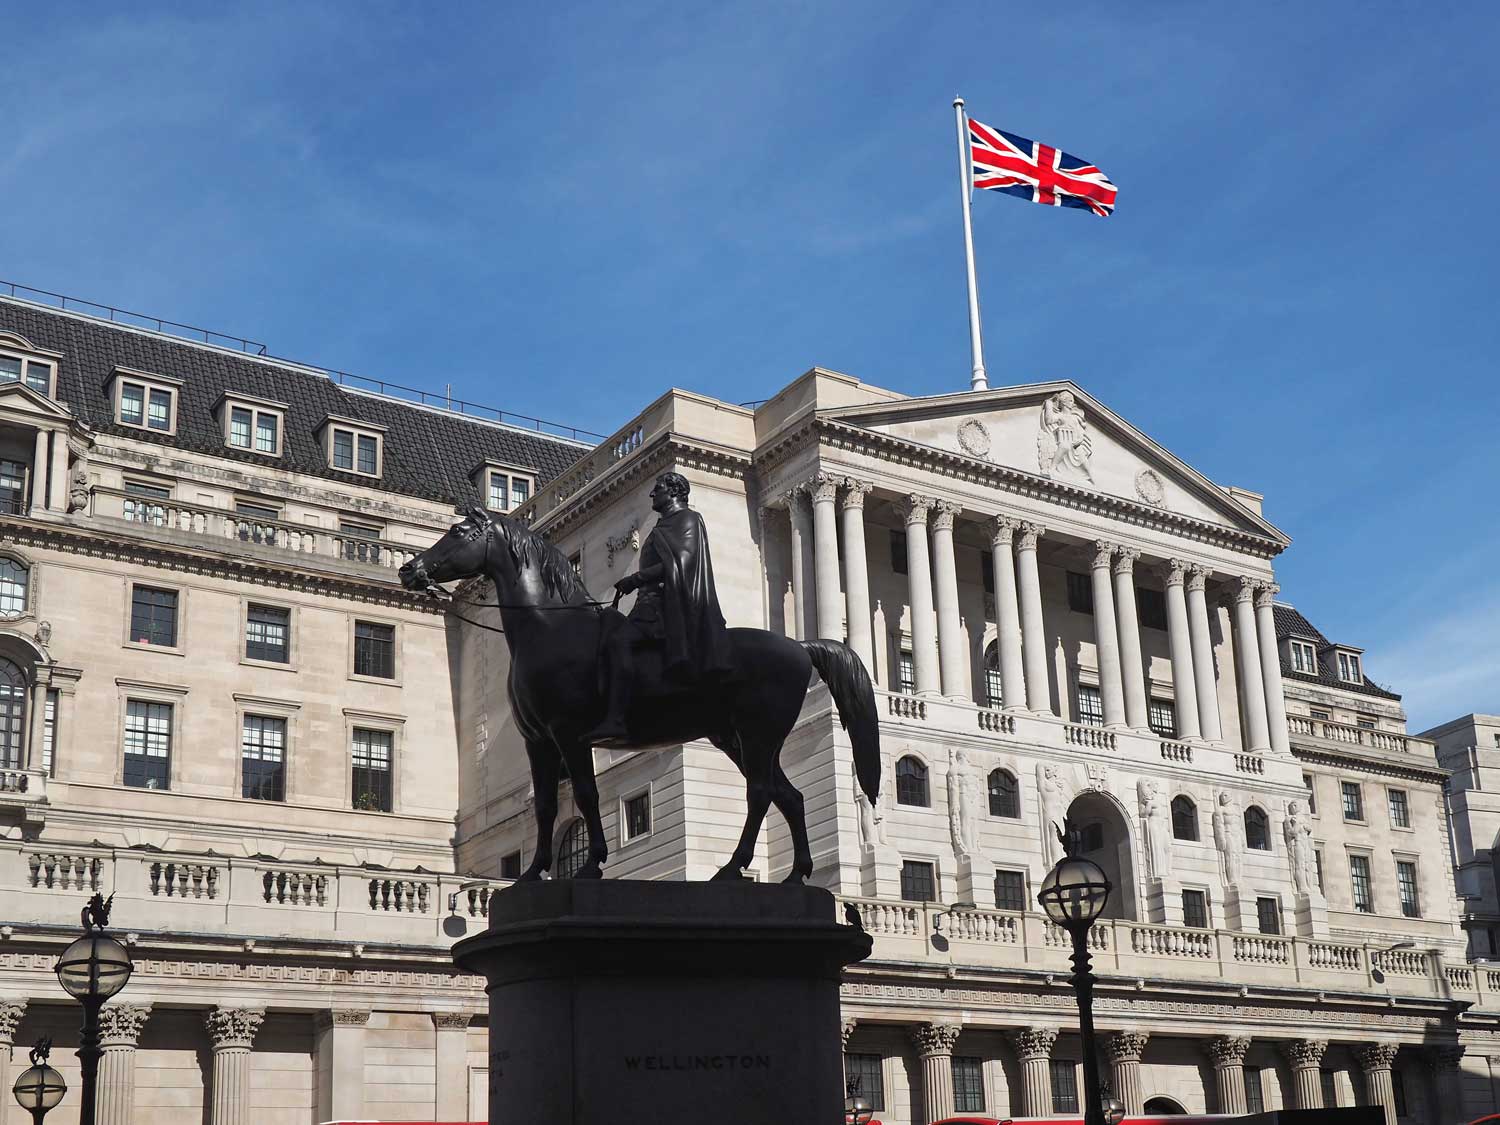
The UK continues to face a significant shortfall in logistics skills, with the Road Haulage Association estimating a deficit of around 50,000 HGV drivers. The ONS also reports 6,000 fewer courier and delivery drivers than the previous year. With 55% of HGV drivers aged between 50 and 65, the demographic imbalance remains a long-term concern.
Factors include reduced access to EU workers post-Brexit, poor industry perception, and limited uptake of government training schemes. Although the crisis is not as acute as during the height of the pandemic, the ageing workforce and lack of young entrants mean structural shortages will continue. Rising wage costs, recruitment struggles, and bottlenecks in road transport all add to the burden on UK supply chains.
5. EV shipping challenges raise alarm
The growth of electric vehicle (EV) trade has created new safety risks at sea. Several high-profile fires on car carriers have been linked to lithium-ion batteries, sparking concern among insurers, regulators, and shipowners. Insurers are pushing for tougher loading protocols, enhanced crew training, and more advanced fire suppression systems.
For supply chains, this adds cost and complexity to automotive logistics, with carriers facing higher insurance premiums and the need to retrofit vessels. It is also slowing the momentum of EV exports, just as demand for cleaner vehicles accelerates globally.
6. Sustainability regulations tighten
Sustainability regulation is reshaping procurement strategies. The EU’s Carbon Border Adjustment Mechanism (CBAM) is beginning to impact trade in carbon-intensive products such as steel, aluminium, and cement, with importers required to report embedded emissions.
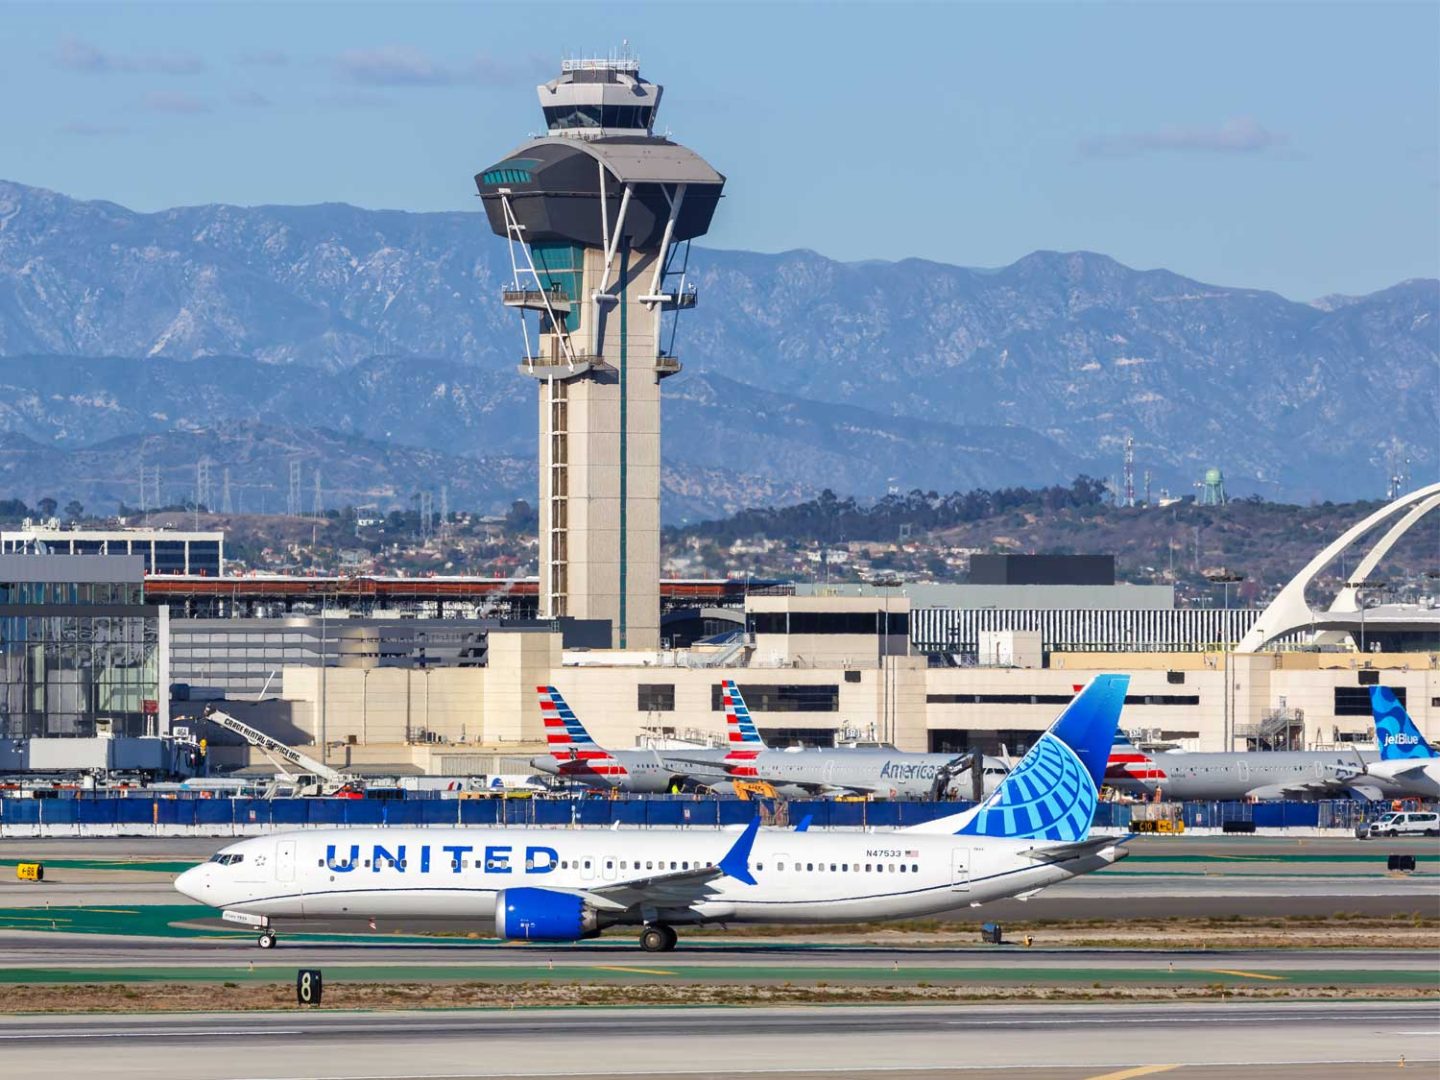
At the same time, sustainable aviation fuel (SAF) is moving toward a tipping point. UK and EU mandates are pushing airlines to integrate SAF into their fuel mix, with new investments underway to scale production.
While tariffs and geopolitics grab headlines, sustainability is quietly becoming a decisive factor in supplier choice, cost structures, and long-term resilience planning. For many organisations, compliance with emissions and ESG frameworks is no longer optional but critical.
Outlook
H1 2025 has exposed the vulnerability of supply chains to political shocks, armed conflict, safety risks, and structural labour shortages. Tariffs, alliances, and attacks have disrupted networks, while long-term challenges around sustainability and skills remain unresolved.
The message for supply chain leaders is clear: resilience, agility, and visibility will be critical in the second half of 2025, as disruption becomes the new normal.
H1 2025 has underlined how vulnerable global supply chains have become and staying ahead demands visibility, expertise, and a trusted partner by your side.
Metro’s account management team works proactively with customers to anticipate risks, share insights, and design solutions that are resilient and adaptable to change.
Our expertise encompasses dangerous goods and lithium battery shipping, customs, and multimodal freight, backed by a strong people strategy that includes apprenticeships, engagement programmes, and our Great Place to Work certification.
We are also leading the way on sustainability. Metro has been carbon neutral for five years, pioneering the use of Sustainable Aviation Fuel (SAF), while our MVT ECO platform helps businesses forecast, measure, and offset emissions across their global supply chains.
EMAIL Andrew Smith, Managing Director, to learn how Metro can build resilience into your supply chain.