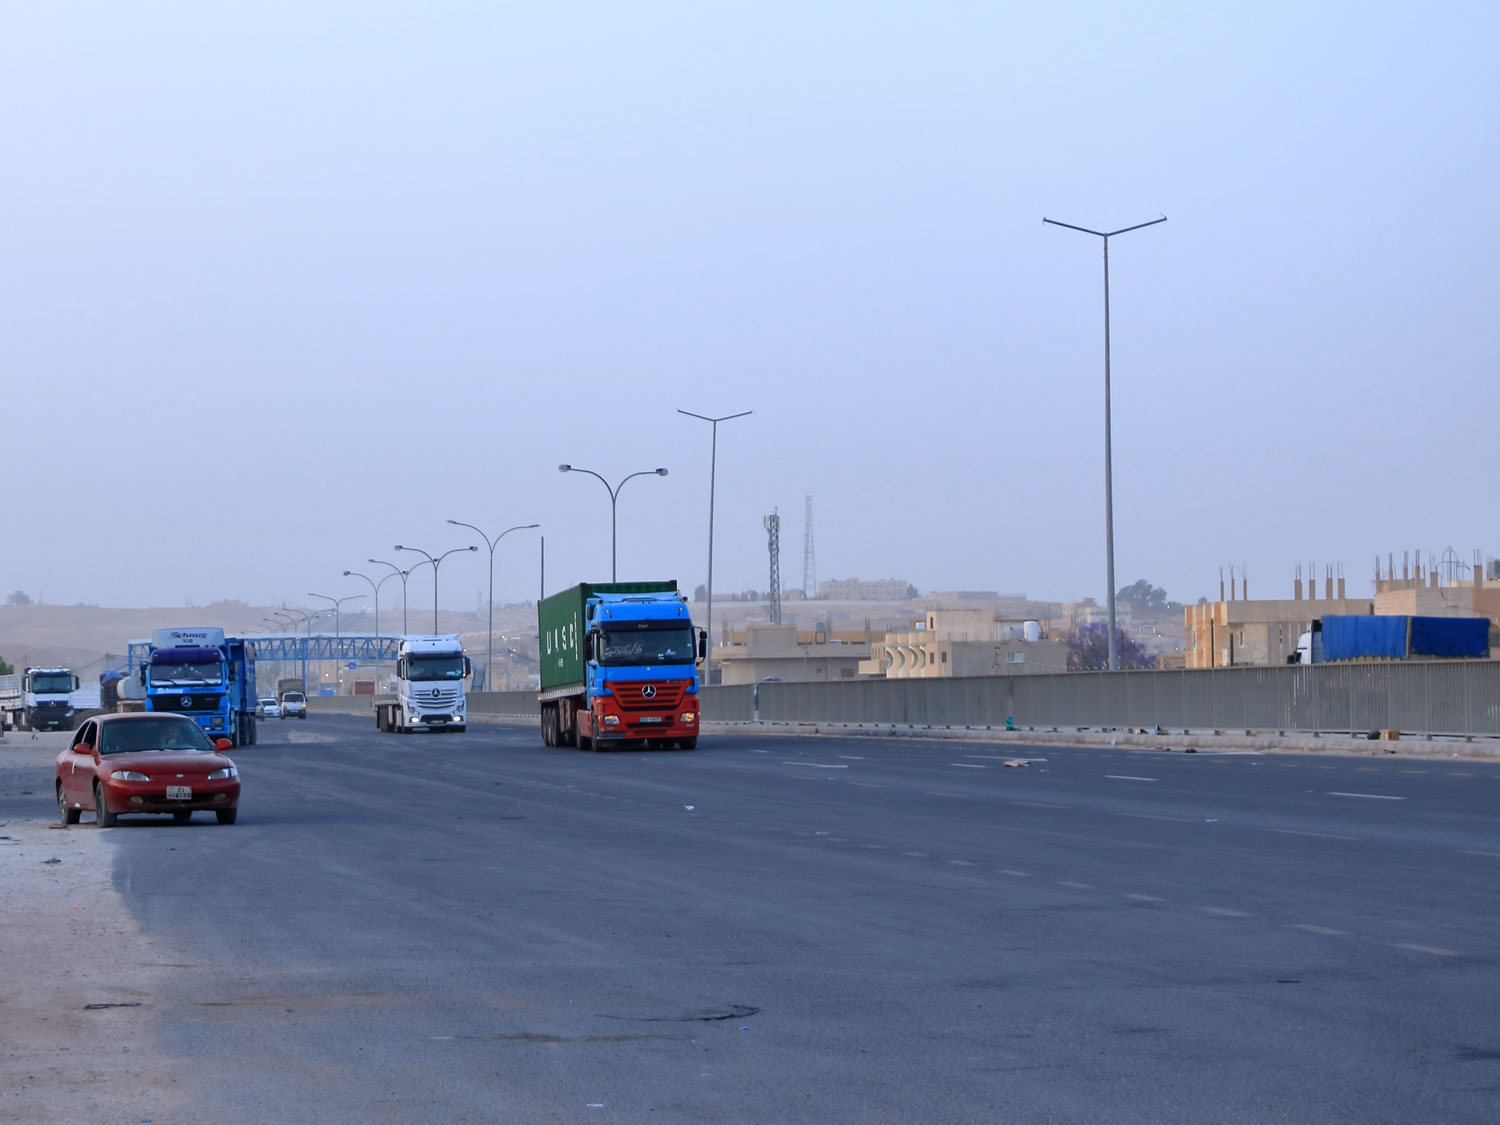
The effective closure of key Gulf shipping routes has halted vessel access to major regional hubs, leaving ships anchored or diverted and forcing carriers to discharge cargo at alternative ports across Oman and the UAE.
These ports are now acting as critical stopgap gateways, but they lack the scale, infrastructure and connectivity of established hubs such as Jebel Ali. As a result, cargo flows are becoming fragmented, with increased reliance on transhipment and secondary routing options.
This disruption is also impacting automotive supply chains. As of 30 March, 15 deep-sea pure car and truck carriers (PCTCs) remain locked in the Persian Gulf, including vessels linked to major Asian operators. Prior to the escalation, more than two dozen PCTCs were calling Gulf ports weekly, underlining the scale of capacity now removed from the market.
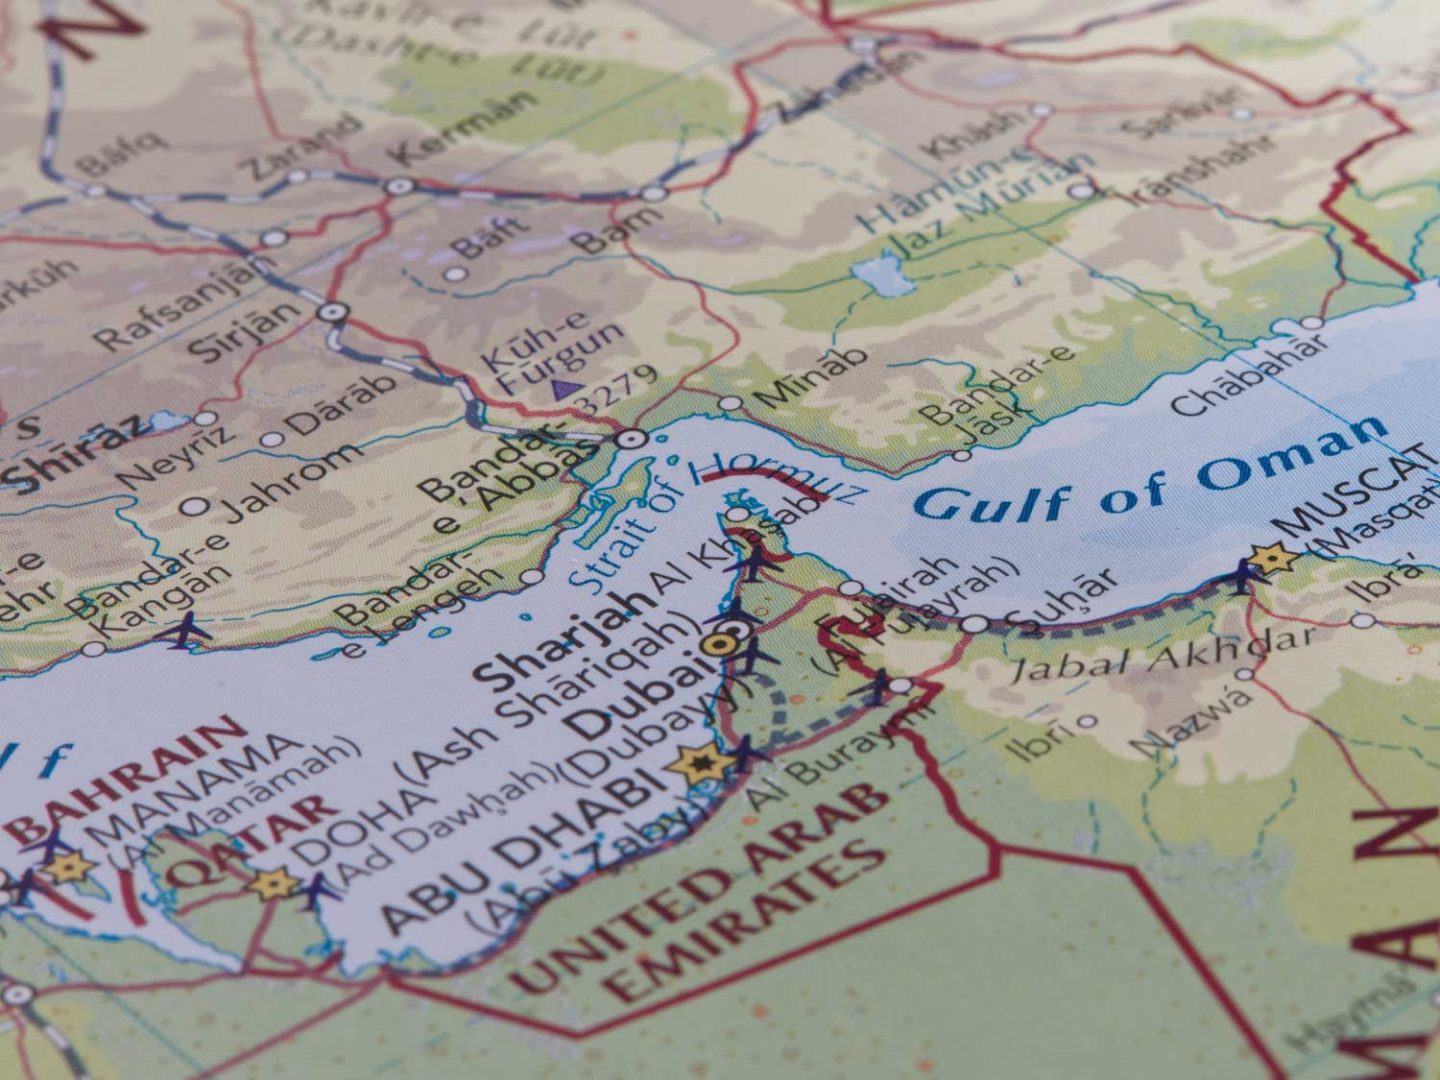
Although the number of vessels directly affected is relatively limited, the impact is amplified by the volume of vehicles already loaded and destined for the region. With transit through the Strait of Hormuz effectively closed, operators are holding cargo on board, returning vessels to origin in Asia, or discharging at alternative locations.
East Africa is emerging as a temporary relief valve, with ports such as Lamu receiving diverted RoRo volumes. Thousands of CEUs are now being held in storage, awaiting clarity on onward routing, further extending lead times and tying up equipment.
At the same time, longer-term routing options remain constrained. Potential alternatives via Red Sea gateways such as Jeddah or Aqaba face their own limitations, particularly as ongoing security concerns continue to divert Asia–Europe RoRo traffic around the Cape of Good Hope.
Pressure is already building across container flows. Congestion is rising at substitute ports, while markets such as Western India are beginning to experience delays as they absorb displaced volumes. Although global trade lanes outside the region remain broadly stable, rerouting activity is increasing and reshaping network dynamics.
A drone strike on the Salalah container terminal on 28 March further exposed the fragility of these alternative networks. The incident forced a temporary closure of one of the region’s key transhipment hubs, disrupting operations at a critical access point for Gulf-bound cargo. While the port reopened three days later, operational constraints are expected to continue, limiting throughput and extending delays.
Equipment imbalances, cargo restrictions and congestion
Beyond routing disruption, structural pressure is building within the ocean freight system. Equipment availability is becoming increasingly uneven as flows are disrupted, with empty container shortages emerging in certain markets.
At the same time, cargo handling restrictions are tightening. Metro is seeing direct evidence across Oman and other regional ports that hazardous containers are no longer being accepted, regardless of classification. Units already on terminal are being required to move off port as a priority.
However, with no viable repatriation hubs available within the region, options are extremely limited. In many cases, hazardous containers must be redirected back to origin or moved to upstream ports outside the affected area, adding cost, delay and operational complexity.
Port congestion remains a persistent constraint. Around 3 million TEU of global capacity is currently tied up in port delays, highlighting the gap between theoretical vessel capacity and the reality of moving cargo through constrained infrastructure.
Even where vessel space exists, operational limitations at ports are restricting throughput. Alternative ports are not configured to handle sustained high-volume flows, while feeder networks and regional services are being adjusted to accommodate changing conditions.
The disruption is also creating wider scheduling challenges, with sailings being rerouted and transit times becoming less predictable as carriers respond to evolving constraints.
Pressure building, with risk of spillover across modes
For now, the global impact remains more contained than previous crises, with major east–west trade lanes continuing to operate. However, underlying pressure is increasing, and the longer disruption persists, the greater the risk of wider spillover across both container and RoRo networks.
Rerouting is becoming more widespread, congestion is building at key alternative gateways and equipment imbalances are beginning to take hold. At the same time, rising oil prices are feeding into bunker costs, adding a further layer of cost pressure across all trades.
The key variable remains duration. If disruption continues, today’s regional challenges are likely to extend into broader network instability, affecting schedule reliability, transit times and overall supply chain predictability across multiple cargo types.
For shippers and other supply chain participants, the focus is shifting towards maintaining flexibility, securing capacity early and planning for multiple routing scenarios as conditions evolve.
Maintain flow across container and automotive supply chains
Metro is helping customers minimise disruption across containerised and automotive supply chains with practical, experience-led solutions.
With secure vessel capacity, alternative discharge strategies and flexible routing options, Metro keeps cargo moving as networks shift, including complex RoRo diversions and delayed vehicle flows.
Metro’s on-the-ground insight into operational constraints, including hazardous cargo restrictions and port-specific limitations, enables early intervention and reduces the risk of costly delays, diversions or cargo being stranded.
Through MVT, customers gain real-time visibility of shipments, congestion and routing options, enabling faster, data-led decisions across both container and automotive movements.
To review your current ocean or automotive supply chain exposure, hazardous cargo options or contingency plans, EMAIL Andrew Smith, Managing Director.